*The Genesis Metrics module is currently in development and running in BETA for select districts.*
Assessments Dashboard
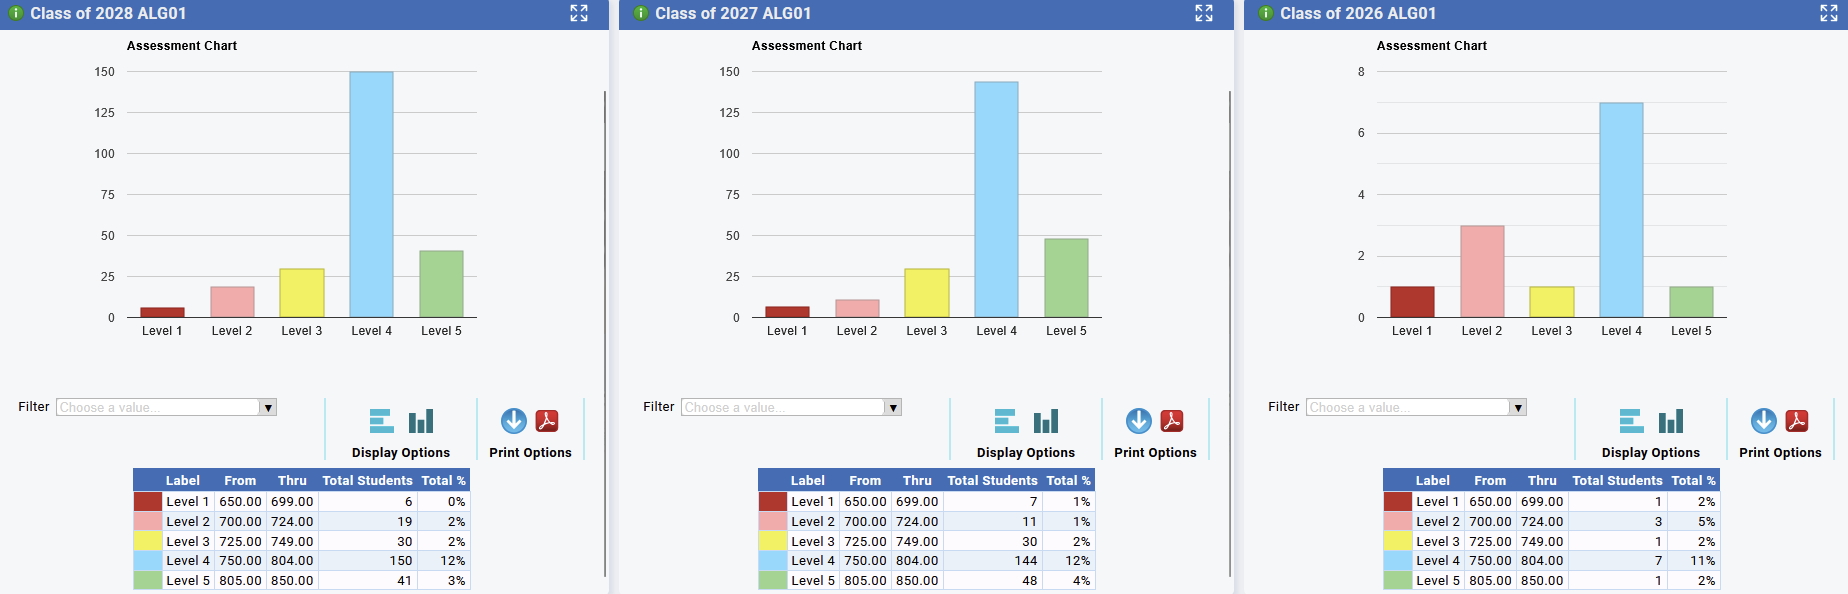
The Assessments Dashboard provides a centralized view of Assessment test scores based on loaded assessment data from the Assessment module. Custom Assessments can also be added to the Assessment Dashboard.
Users can analyze Assessment data by selecting :
- Class Of
- Score Setup (Assessment)
If multiple Class Of and Exams are selected, the charts will display with each class of being a column, allowing you to compare exams results from different Class Of categories, at a glance.
Assessment Widget - Panels
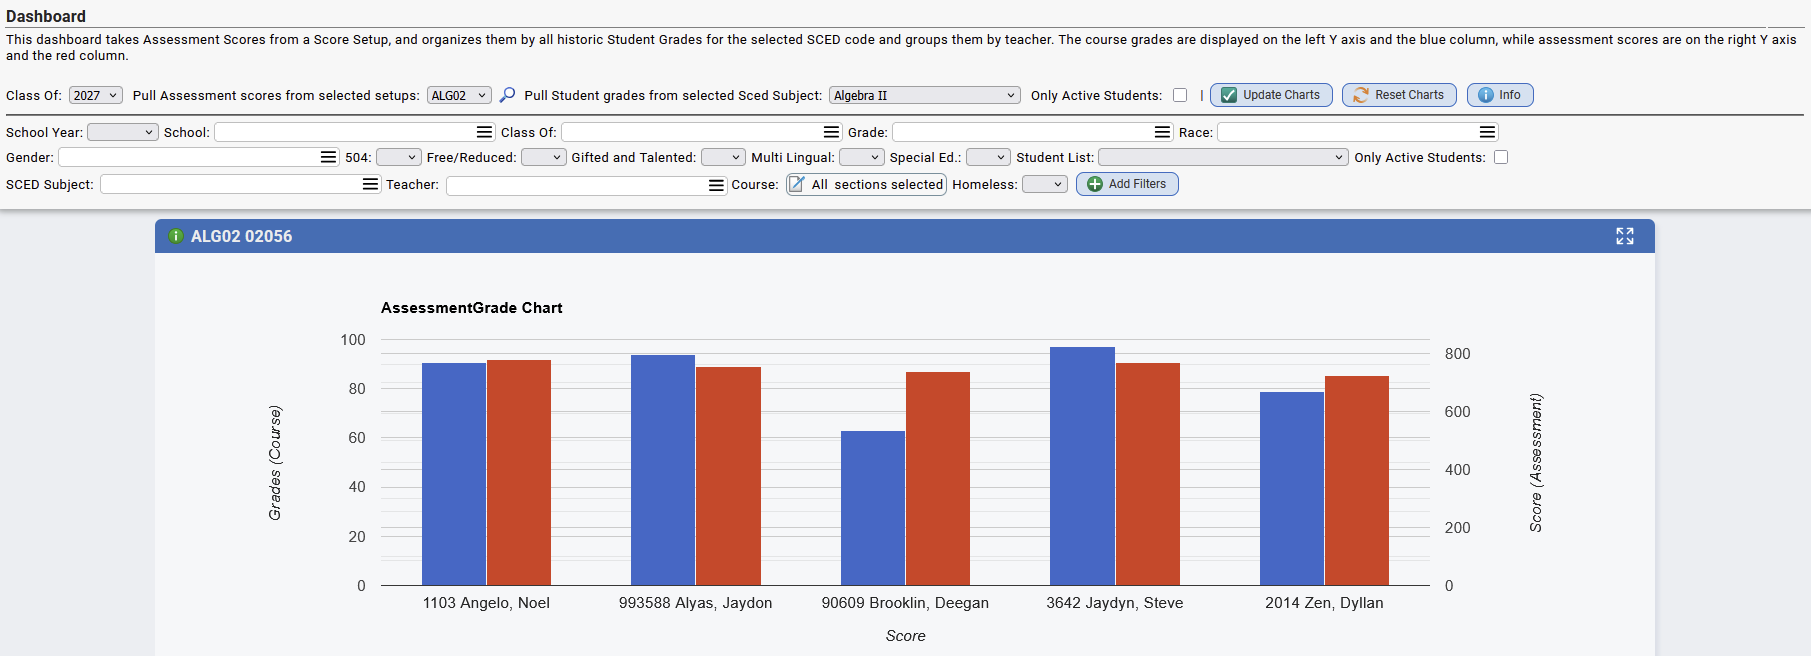
Advanced Filters

- Metrics Assessments (all tabs) now include filtering by Class Of, Grade, Race, Gender, 504, F/R, Gifted, ML, Spec Ed, Student List, Active, SCED Subject + Teacher + Course.
- SCED Subject + Teacher + Course are connected to one another, selecting a subject will only display teachers in that subject. Selected teachers will only display courses that they teach.
SCED Subject + Teacher + Course is a special filter that allows you to filter out students who have been in a specific sced subject, had a certain teacher, or took a certain course section. By Selecting a SCED subject the teacher filter will only show teachers who teach that subject, for example Algebra 1 will only show Algebra 1 teachers. Additionally, the Course filter will then only show courses for those teachers for all school years. You can then select those courses by course code, teacher id, school year, and/or the school they were taught in.
Grades Tab
- Quickly view and compare Course Grades to Assessment scores, by the teacher.
- The Grades tab takes Assessment Scores from a Score Setup, and organizes them by all historic Student Grades for the selected SCED code and groups them by teacher. The course grades are displayed on the left Y axis and the blue column, while assessment scores are on the right Y axis and the red column.
- Users can specify the following to view the Course & Assessment data:
- Class Of
- Assessments
- SCED Subject
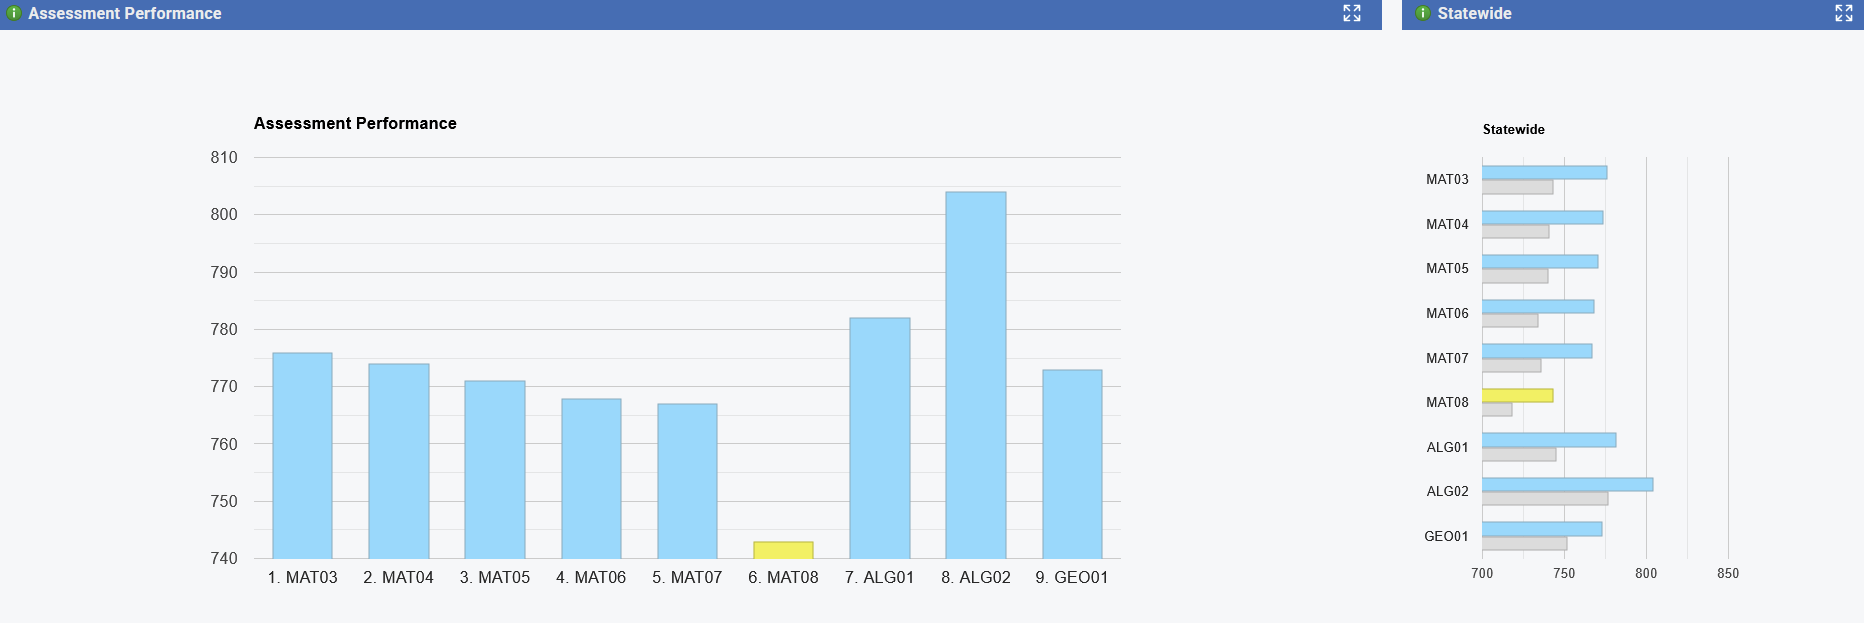
Performance Tab
- Performance Chart to display Assessment performance averages and State Average comparisons.
- Can filter these by assessment year in addition to the default filters
- Also displays the calculated averages for the Assessment on the right side, comparing for example the average ALG01 score for the District vs. the State average for ALG01. These are stored by school year and go back to 2021-22.
Data Range Sets
Assessment widget panels categorize scores into predefined ranges, which can be customized under Metrics > Setup > Data Range Sets > Assessment Ranges.

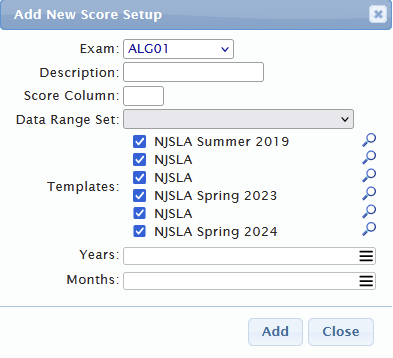
Assessment Score Setup
Proper setup of the Assessment Dashboard requires mapping Genesis Exams to Assessments for accurate reporting. Assessment mapping can be configured under Metrics > Setup > Assessment Scores.
- Ability to flag score setups to be used in Tiers as rules, by default Assessment setups that are auto generated will automatically be flagged as able to be used in tiers
- If Assessment scores are detected during startup, the scores are automatically loaded into metrics if they can be properly detected

Was this article helpful?
That’s Great!
Thank you for your feedback
Sorry! We couldn't be helpful
Thank you for your feedback
Feedback sent
We appreciate your effort and will try to fix the article